McDATA Eclipse 2640 SAN Technické informace Strana 170
- Strana / 276
- Tabulka s obsahem
- ŘEŠENÍ PROBLÉMŮ
- KNIHY

- 2640 SAN Router 1
- Revision Date Description 2
- Contents 3
- Chapter 8 Troubleshooting 6
- Figures 9
- Tab le s 11
- Overview 19
- SAN Router Features 22
- Scalability Metrics 23
- SAN Router Layout 24
- Configuring System 25
- Configuring the SAN Router 26
- Configuring System Basics 27
- Using the Element Manager 29
- Element Manager Overview 30
- Starting the Element Manager 31
- Element Manager window 33
- Getting Help 35
- Keyboard Shortcuts 35
- Getting Write Permission 35
- Settings\<login-name> 37
- Configuring IP Addresses 39
- The Router Inband IP Address 41
- The Internal IP Address 43
- • SNMP Protocol (161) 46
- • SNMP Traps (162) 46
- Configuring System Operations 47
- System Properties Dialog Box 48
- Login Banner 49
- Procedure 50
- Date/Time Dialog Box 51
- Configuring SNMP 54
- Configuring Trap Recipients 57
- Tra ps dialog box ( 57
- Figure 2-15 on page 2-34) 57
- SNMP Traps Dialog Box 58
- Configuring mSNS 59
- Configuring New Device Zoning 59
- Static Routes 60
- Configuring RADs and 65
- Configuring R_Ports for mSANs 70
- Table 3-1 R_Port Parameters 72
- R_port Compatibility 78
- Configuring iSAN 79
- Setting the iFCP Parameters 87
- Configuring iFCP Connections 92
- Remote Connections Dialog Box 93
- Table 4-2 96
- Configuring iSAN Connections 101
- MAN/WAN Links 102
- Automatic Communication 103
- Configuring iSCSI 109
- Connections 109
- Introduction 110
- Example Configuration 111
- Configuring iSCSI Ports 112
- Configuring iSCSI Connections 113
- Advanced TCP Configuration 114
- Setting the iSCSI parameters 117
- Configuring iSCSI Devices 121
- Adding iSCSI Devices Manually 122
- Zoning iSCSI Devices 127
- Computer Management Window 132
- Using Static Routes 135
- Using RADIUS Authentication 136
- Add Target Portal Dialog Box 138
- Table 5-1 Static Route 146
- Add Static Route Dialog Box 147
- Monitoring SAN Router 149
- Operation and 149
- Device View 150
- Table 6-1 Port LED Colors 151
- FC Port Tool Tip 153
- FC R_Port Tool Tip 153
- System Information 154
- Table 6-3 System Status LEDs 155
- Performance Bar Tool Tip 156
- System Temperature Tool Tip 157
- Power Supply Tool Tip 157
- Fan Tool Tip 158
- Message Log 158
- Setting the Polling Interval 159
- Using the System Log 160
- Viewing Statistics 162
- Table 6-6 163
- Fibre Channel/Port Statistics 166
- Figure 6-16) 168
- Port Traffic Statistics 169
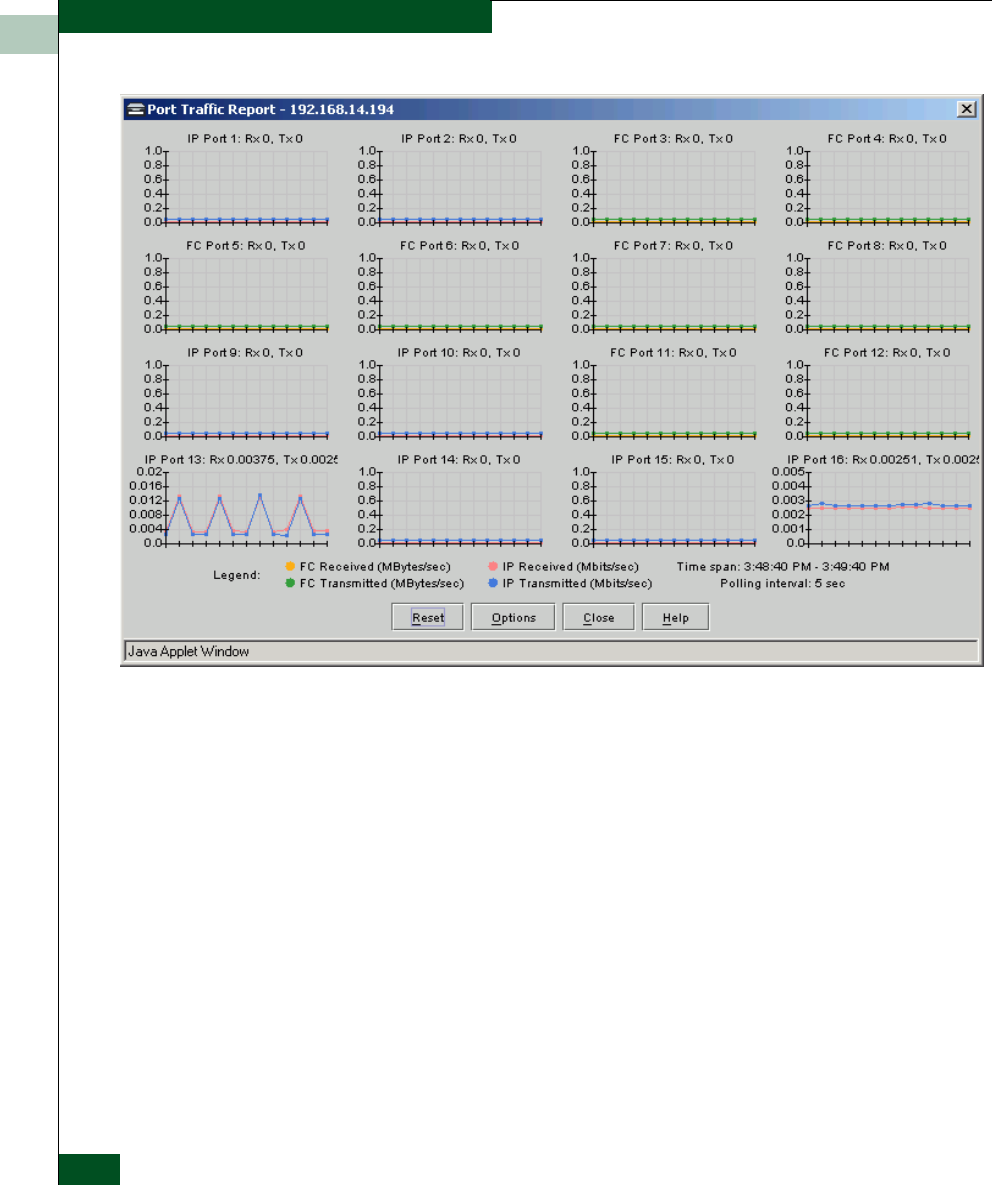
- Port Traffic Report 170
- Chart Options Dialog Box 171
- MAC Forwarding 174
- MAC Forward Table Dialog Box 175
- IP Forwarding 176
- Table 6-10 IP Forwarding 177
- ARP Table Dialog Box 178
- Table 6-11 ARP Table 179
- Remote Connection Statistics 181
- Configuration, Firmware 187
- Maintenance 187
- Upgrading Firmware (E/OSi) 188
- Upgrading bootrom (E/OSi) 191
- Resetting the System 192
- Delete the System Log 201
- Troubleshooting 203
- SAN Router Troubleshooting 207
- Glossary 211
- NUMERICS 212
Související produkty a manuály pro Sítě McDATA Eclipse 2640 SAN
 (26 stránky)
(102 stránky)
(26 stránky)
(102 stránky)
 (4 stránky)
© 2020, manymanuals.cz. Všechna práva vyhrazena. | 0.060 s |
 Manymanuals.com
 Manymanuals.de
 Manymanuals.fr
 Manymanuals.it
 Manymanuals.pl
 Manymanuals.cz
 Manymanuals.es
 Manymanuals-pt.com
Komentáře k této Příručce